Project Description
This is a learning module concept on renewable energy. It was created in Keynote and is built as an interactive presentation. Ideally, this would exist as an eLearning module embedded within an LMS or company website to provide information, statistics, and trends to learners. The information, KinetECO assets, and data sets were provided and the visual aids, script, and narration were created by the designer. Each slide has an accompanying narration with animations to communicate with learners both verbally and non-verbally. The target demographic for this module are adults between 18 - 54 years old.
This is a concept piece and not actual work for KinetECO.
Video presentation
Above is a video walk-through of the learning module to demonstrate how the narration and visuals work together.
Slides
The color palette for the presentation draws inspiration from the kinetECO identity.
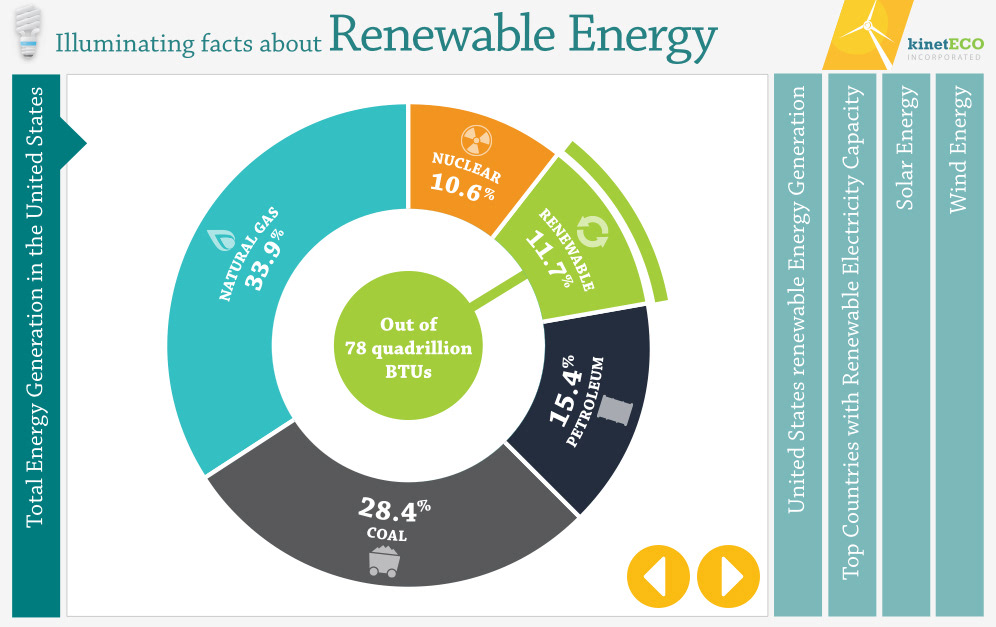
This slide addresses the total energy consumed in the US so a hollow pie chart is used to help visualize each industry's shares while highlighting the one of interest with a visual cue.
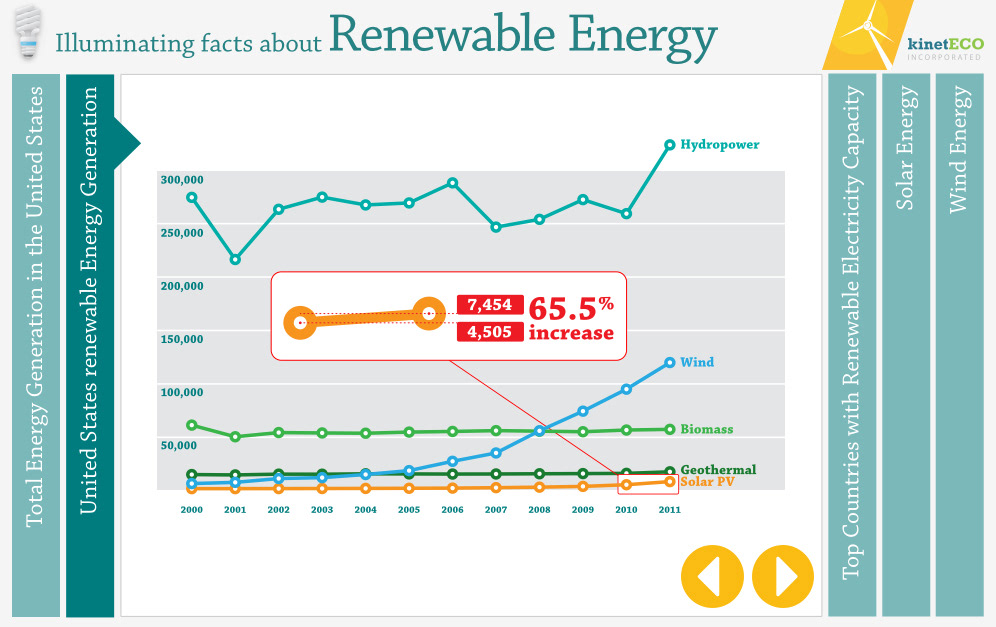
Since the scale of this graph focuses on total values rather than rate of growth, an otherwise concealed piece of data is highlighted by creating a pop-out feature for Solar's growth.
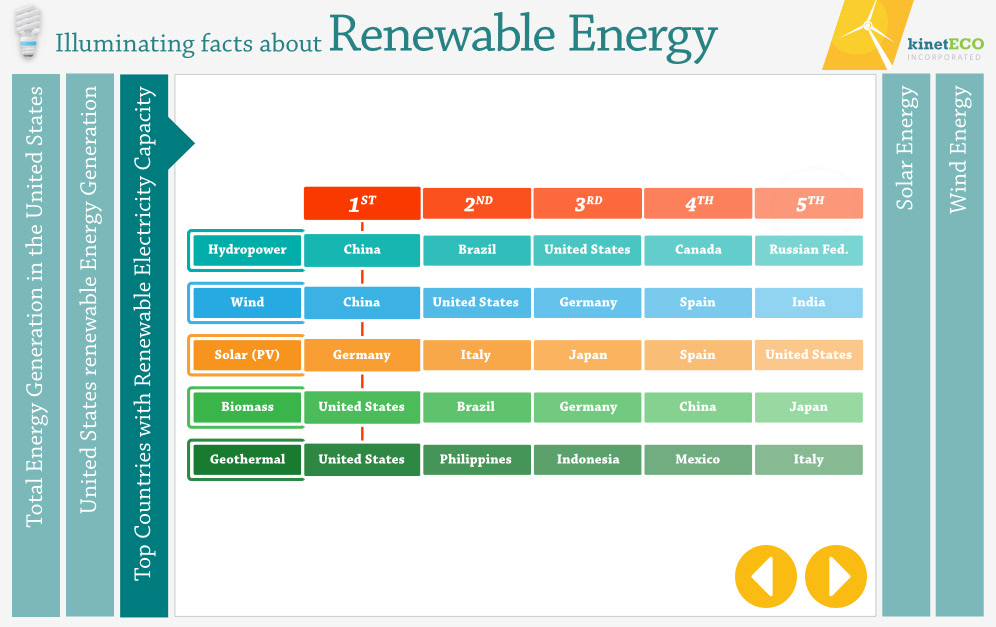
Because of the repetitive nature of represented lists animations were used (not seen here) to highlight certain countries in coordination with the narration for this slide. Subtle tint shifts were used to create a gradient to communicate rank.
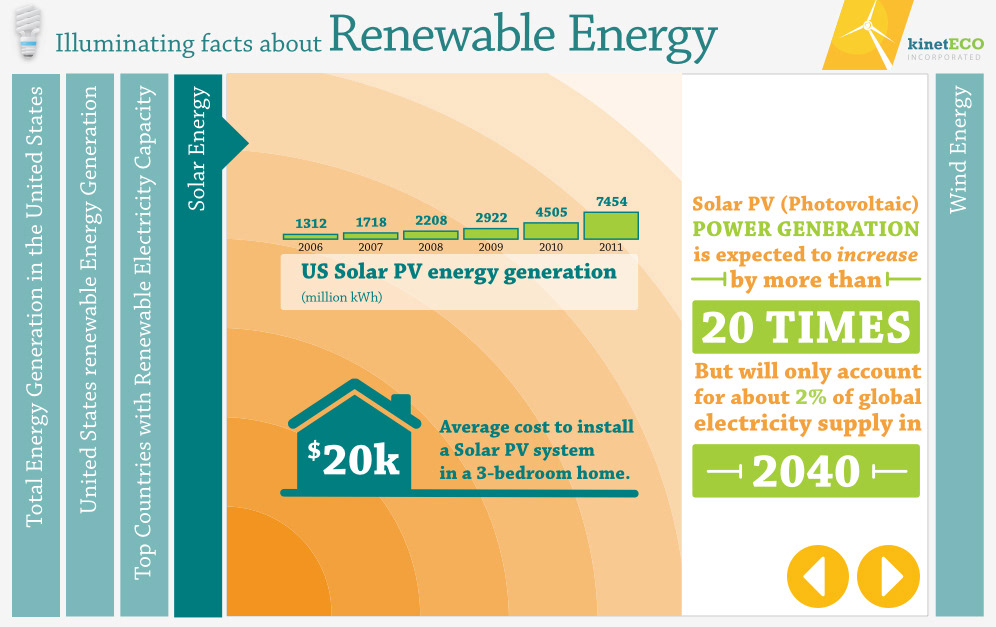
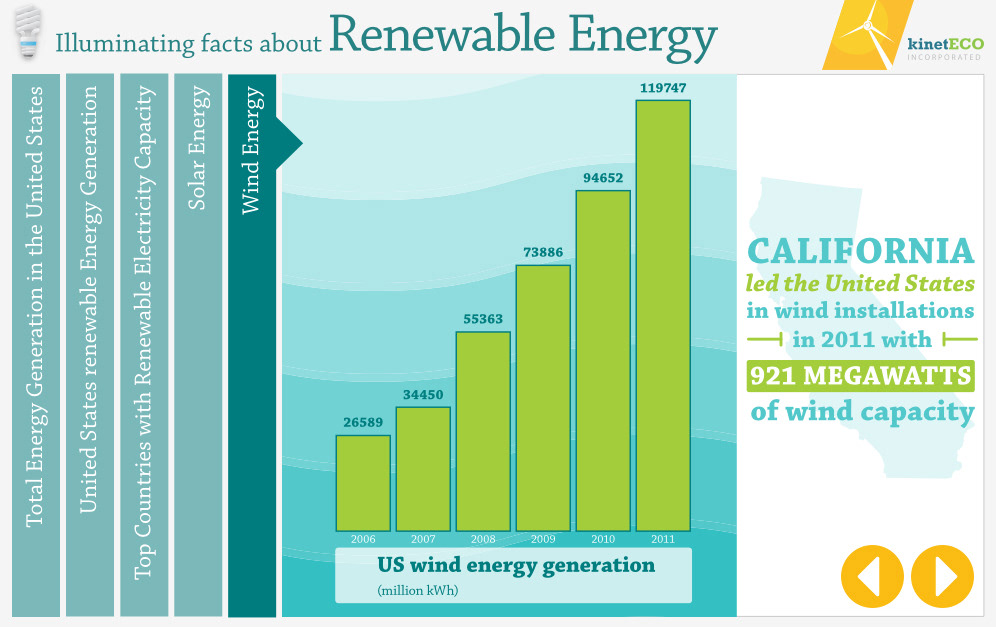
This slide incorporates an abstract background to reinforce the solar theme of information being discussed, and balancing the visuals in the main frame with visual typography on the right. The same strategy was used on the following slide that focused on wind energies.